All Courses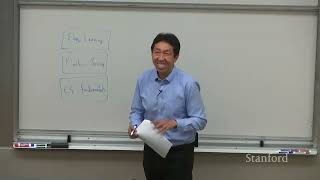
Stanford CS230: Deep Learning
9 lectures
Course Content
1
Stanford CS230 | Autumn 2025 | Lecture 1: Introduction to Deep Learning
This lecture kicks off Stanford CS230 and explains what deep learning is: a kind of machine learning that uses multi-layer neural networks to learn complex patterns. Andrew Ng highlights its strength in understanding images, language, and speech by learning layered features like edges, textures, and objects. The message is that deep learning’s power comes from big data, flexible architectures, and non-linear functions that let models represent complex relationships.
Stanford Onlinebeginner
2
Stanford CS230 | Autumn 2025 | Lecture 2: Supervised, Self-Supervised, & Weakly Supervised Learning
Decision trees are models that make predictions by asking a series of yes/no questions about features, like a flowchart. You start at a root question, follow branches based on answers, and end at a leaf that gives the prediction. This simple structure makes them easy to read and explain to anyone.
Stanfordbeginner
3
Stanford CS230 | Autumn 2025 | Lecture 3: Full Cycle of a DL project
This lecture introduces supervised learning for regression, where the goal is to predict a real number (like house price) from input features (like square footage, bedrooms, and location). You represent each example as a d-dimensional vector x with a target y. Linear regression models this relationship with a straight-line formula: f(x) = w^T x + b. The focus is on learning weights w and bias b that best map inputs to outputs.
Stanfordbeginner
4
Stanford CS230 | Autumn 2025 | Lecture 4: Adversarial Robustness and Generative Models
The lecture explains why we use machine learning instead of writing step-by-step rules. Many real problems, like finding cats in photos, are too messy for hand-written rules because there are too many exceptions. With machine learning, we give the computer lots of examples and it discovers patterns on its own. This approach lets computers handle tasks we can’t easily explain in code.
Stanfordbeginner
5
Stanford CS230 | Autumn 2025 | Lecture 5: Deep Reinforcement Learning
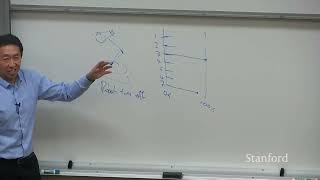
Logistic regression is a simple method for binary classification that outputs a probability between 0 and 1 for class 1. It takes a weighted sum of input features (w^T x + b) and passes it through the sigmoid function. The sigmoid is an S-shaped curve that squashes any real number into the [0,1] range.
Stanfordbeginner
6
Stanford CS230 | Autumn 2025 | Lecture 6: AI Project Strategy
This lecture explains decision trees as simple, rule-based models for classification and regression. A decision tree splits data by asking yes/no questions about features until the remaining data in a group is mostly one label (pure). Each leaf makes a final prediction by majority vote for classification or by average value for regression. Trees are powerful, easy to understand, and highly interpretable.
Stanfordbeginner
7
Stanford CS230 | Autumn 2025 | Lecture 8: Agents, Prompts, and RAG
This session sets up course logistics and introduces core machine learning ideas. You learn when and how class meets, where to find materials, how grading works, and why MATLAB is used. It also sets expectations: the course is challenging, homeworks are crucial, and live attendance is encouraged.
Stanfordbeginner
8
Stanford CS230 | Autumn 2025 | Lecture 9: Career Advice in AI
This lecture explains how to choose and fairly evaluate machine learning models so they work well on new, unseen data. The main goal is generalization, which means the model should not only do well on the training set but also on future examples. Overfitting (too complex) and underfitting (too simple) are the two big mistakes to avoid.
Stanfordbeginner
9
Stanford CS230 | Autumn 2025 | Lecture 10: What’s Going On Inside My Model?
This lecture teaches linear regression as a simple but powerful way to predict a number (output) from input features. The model assumes a straight-line relationship between inputs and output, written as y = W^T x. Each weight in W shows how much a feature pushes the prediction up or down.
Stanfordbeginner